
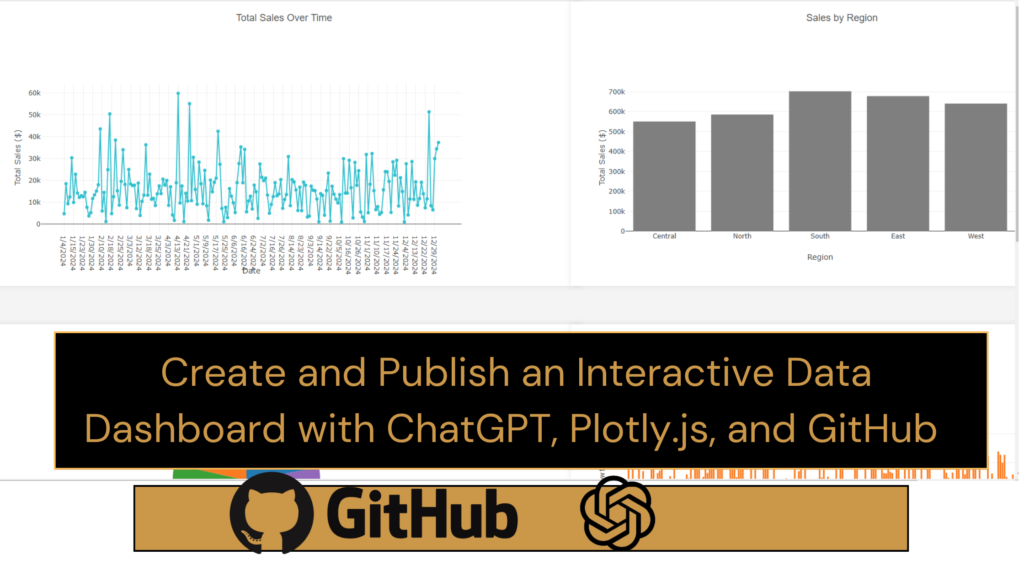
Transform your raw spreadsheet data into a visual, interactive dashboard. This guide shows you how to convert plain numbers into clear charts and graphs using ChatGPT and free tools.
- Begin with any basic CSV file.
- Convert your CSV file to JSON using an online converter.
- Copy a snippet of your JSON file and use it with ChatGPT.
- Paste the JSON into ChatGPT and use these prompts:
👉 Prompt 1
This is the structure of my data in JSON format. Understand the structure and suggest five key data visualization metrics that would be the best fit to create an interactive dashboard. Also explain why we should use each one?

👉 Prompt 2
Now, I want you to create an interactive performance dashboard with the five key visualizations using HTML and JavaScript. Use the latest version of Plotly.js CDN and include an upload feature so that we can upload the JSON file. It should generate the dashboard based on the uploaded data.

Note 1: This prompt directs ChatGPT to build a webpage that transforms your raw data into an interactive dashboard. It uses HTML and JavaScript with the latest version of Plotly.js to create dynamic visualizations and includes an upload feature so you can load your local JSON file directly. While it initially requests five key visualization metrics, you can ask for additional metrics if you need more insights.

Note 2: I need to upload the data from my local computer, and it should create the dashboard based on that data.

👉 Prompt 3
Provide this as an HTML downloadable file?
- Run the prompts one by one in ChatGPT.
- The first prompt helps you choose five key visualization metrics.
This ensures you focus on the data that matters most. - The second prompt creates the dashboard in HTML and JavaScript.
It uses Plotly.js and adds an upload feature for your JSON file. - The third prompt generates a downloadable HTML file so you can save and share your work.
- Finally, publish your dashboard on GitHub Pages to make it public.
Upload the HTML file, set the repository as public, and share your URL.
Your data now transforms into an interactive tool.
What key insight will you visualize today?
What design tweaks will you apply to best tell your data’s story?